|
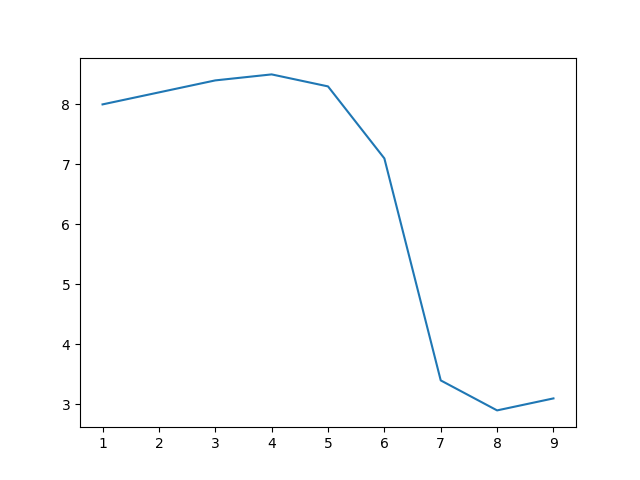
| plate-001 - Super simple plot of data from a text file. The displayed figure is scaled to a width of 400 px by the html code. |
|
|
| plate-001 - Super simple plot of data from a text file. The displayed figure is scaled to a width of 400 px by the html code. |
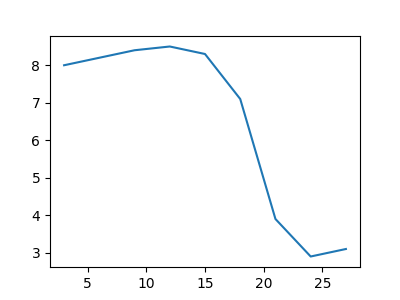
For the next three (plate-002), I changed the data a bit to show the effect of equal axis in the last image.
|
| plate-002-z1 - This time, the figure size (width = 400 px) is controlled by matplotlib. It's a bit funky. The way I understand it, matplotlib likes to work in inches. So controlling the pixel size of an image is best done by setting the dimensions in pixels and also setting a dots per inch. To get it all to come out right, I had to set the dpi in both plt.figure and plt.savefig. This figure used a dpi = 100. |
|
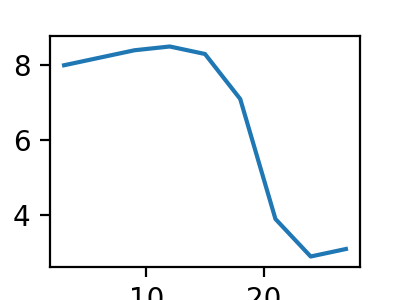
| plate-002-z2 - The font isn't adjusted to fit within the figure size. Here dpi = 200 and the x tick labels are cut-off. |
|
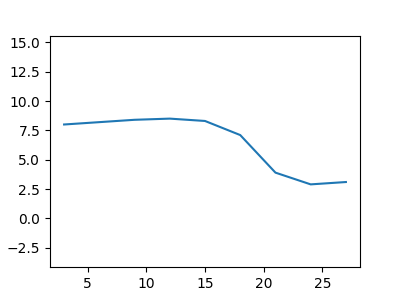
| plate-002-z3 - This is like z1 except that I set plt.axis('equal'). The tick marks are not necessarily evenly spaced, but the scale along the x and y axes is the same. |
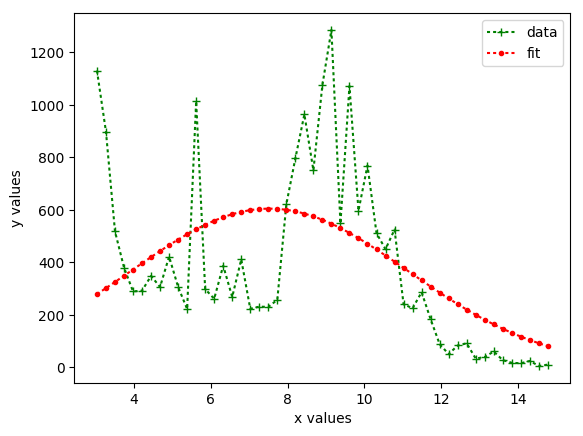
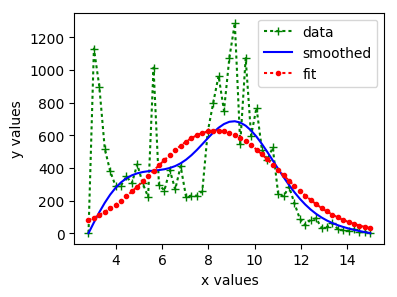
The code here was adapted from stackoverflow 19206332 around 2018-04. I used some of my data. The idea is to first fit a Gaussian curve to noisy data. Then, to see if we can have the curver pic out a particular set of the data when it is multi-modal. Still working at that last part.
|
| plate-101a - scaled with html - UNDER CONSTRUCTION. |
|
| plate-101b - scaled with html - UNDER CONSTRUCTION. |